Three months have passed since my last State of the Blogosphere report, so time for an update on the numbers. For those of you who just want the most interesting tidbits, I've tried something new this time around - I've put in boldface the most significant information. There's also a summary at the bottom of the post for those of you who just want the significant details.
50 Million Blogs and Counting.
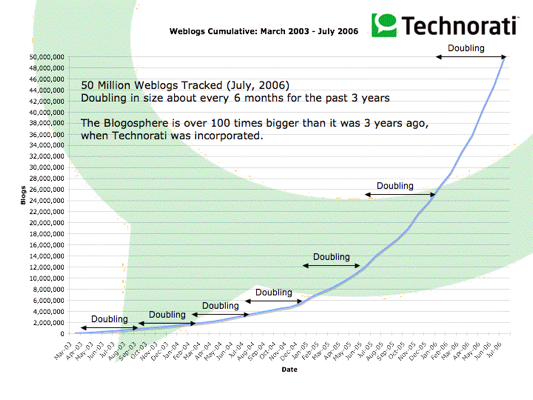
On July 31, 2006, Technorati tracked its 50 millionth blog. The blogosphere that Technorati tracks continues to show significant growth. The chart below (click to get a full-sized version) has the details:
Technorati has been tracking the blogosphere, or world of weblogs, since November 2002, and I'm constantly amazed at the growth over the years. The blogosphere has been doubling in size every 6 months or so. It is over 100 times bigger than it was just 3 years ago.
Whenever I write about these statistics, I'm always asked by people, "Can it continue to grow this quickly?" Frankly, I can't possibly imagine it continuing to grow at this pace - after all, there are only so many human beings in the world! It has to slow down.
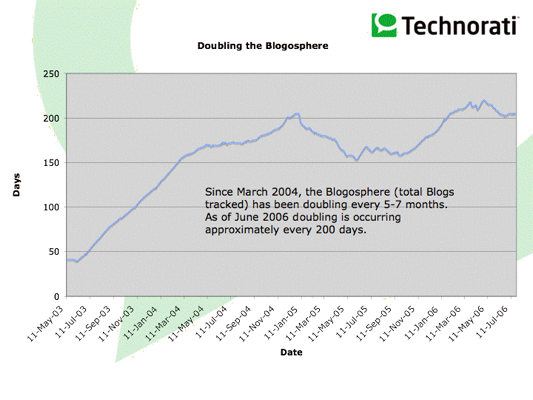
Rather than just postulate on this, we now have enough data to actually look at the real numbers - The rate at which the blogosphere has doubled over time, as shown in the chart below:
As this chart shows, back in November of 2003, the blogosphere had doubled in size in 40 days - probably because Technorati was new and was just picking up all of the blogs that were out there in the world. In January of 2004, the blogosphere was doubling at a rate of once ever 120 days, which is about once every 4 months. By July of 2004, the blogosphere was doubling every 180 days, or about once every 6 months. Today, the blogosphere is doubling in size every 200 days, or about once every 6 and a half months. That means things have slowed somewhat - the rate of doubling has increased by about half a month to once every seven months.
What I found so interesting in these numbers is that the graph has stayed so flat in the range of 150-200 day doublings for so long. From January 2004 until July 2006, almost two and a half years later, the number of blogs that Technorati tracks has continued to double every 5-7 months.
Can this possibly continue? Will I be posting about the 100 Millionth blog tracked in February of 2007? I can't imagine that things will continue at this blistering pace - it has got to slow down. After all, that would mean that there will be more bloggers around in 7 months than there are bloggers around in total today. I shake my head as I am writing this - the only thing still niggling at my brain is that I'd have been perfectly confident making the same statement 7 months ago when we had tracked our 25 Millionth blog, and I've just proven myself wrong.
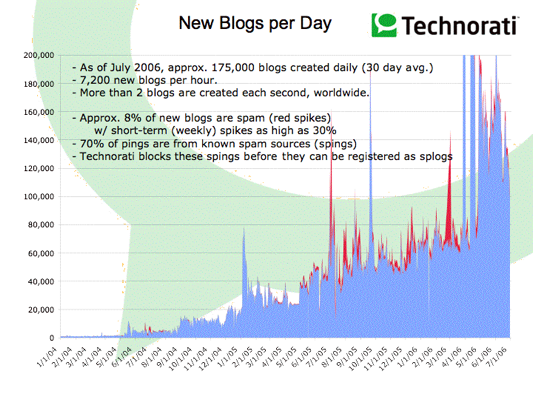
Let's look at the number of new blogs tracked each day, to get another look at the numbers:
As of July 2006, about 175,000 new weblogs were created each day, which means that on average, there are more than 2 blogs created each second of each day.
Surely some of these new blogs in Technorati's index are Spam blogs or 'splogs'. The spikes in red on the chart above shows the increased activity that occurs when spammers create massive numbers of fake blogs and try to get them into our indexes. This is going to be a fight that is going to continue as long as people find the web useful, and there's really no way to make sure that we catch every single spam blog before it goes into our indexes. We've been working extremely hard on understanding these spam patterns, and
- eliminating the spam from our indexes as quickly as possible, and
- making sure that these identified sources of spam (and spam creation patterns) never even make it into the index when they attempt to do so in the future.
What we have found, after lots of analysis and spam elimination, is that we see about 8% of new blogs that get past our filters and make it into the index, even if it is only for a few hours or days. In other words, we're always going to pay a price to make the blogosphere as open a place as possible, and Technorati will always have some results that are spammy. We're going to have to continue be extremely vigilant to make sure that new attacks are spotted and eliminated as quickly as possible. About 70% of the pings Technorati receives are from known spam sources, for example, but we're able to drop them before we even send out a spider to go and index the splog.
Of course, we're also going to make some mistakes - so if you think your blog is possibly misclassified, go and have a look at your blog profile (here's mine, for example)- simply type in your blog homepage URL to see what Technorati thinks it knows about your blog. If you don't see your newest posts showing up, make sure that you've claimed your blog. If all else fails, please let us know about it, and we'll try to fix it for you. Please note that if you have multiple URLs for your blog (e.g. Typepad users often have multiple URLs for their blogs, as do some other services) to please try the alternative URLs as well before dropping us a support ticket.
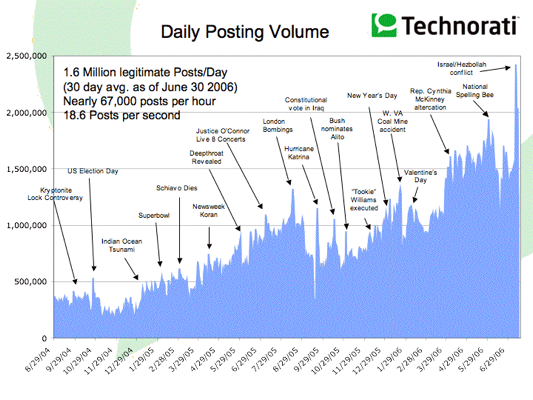
OK, back to the fun. Here's a look at the daily posting volume in data that Technorati tracks:
First off, the total posting volume of the blogosphere continues to rise, showing about 1.6 Million postings per day, or about 18.6 posts per second. This is about double the volume of about a year ago. Along with the aggregate posting volume information, we've put in some annotations of the events that occurred at the time of the spikes, showing that the blogosphere continues to react strongly to various world events. It is important to note that it is the relative increase in posting volume rather than the absolute increase that is most relevant here. In other words, because more people are blogging now, the total number of posts on a particular day don't tell the whole tale of the impact of an event - For example, The National Spelling Bee was not as large an event in the blogosphere as Hurricane Katrina. What is important to note in these charts is the relative size of the spike in relation to the posting volume at that time.
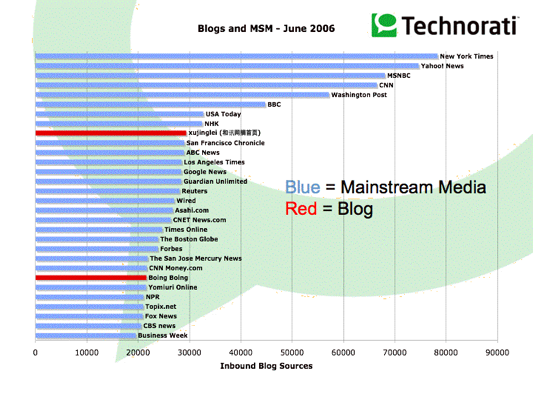
Another interesting item to note is the level of influence that blogs are having, especially compared with the mainstream media (MSM). This chart is somewhat biased towards western sources of the MSM, and if you see a source that is missing from this (or the next) chart, please let me know.
What is interesting is that some of the most influential weblogs are being treated in much the same way as traditional MSM, as measured by the number of bloggers who are linking to them, as shown in the chart below:
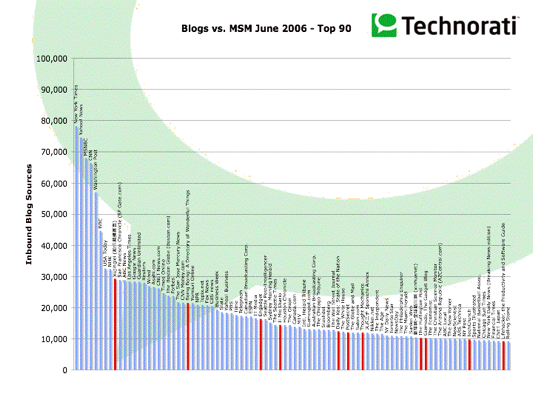
The blogs are in red, MSM in blue. What becomes more interesting to me, however, is that as you continue down the long tail of media sites, the number of blogs starts to grow - to 11 of the top 90 sites, or 12.2% of the total, especially given the budget differentials, as shown below:
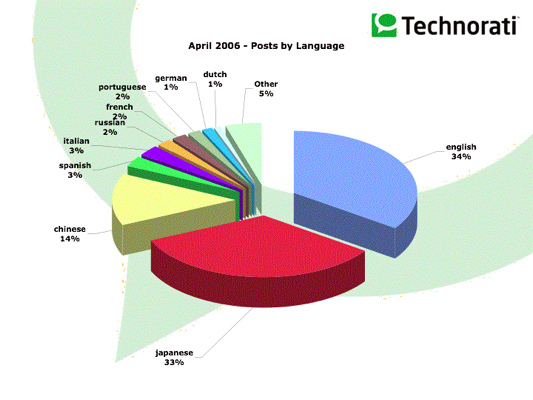
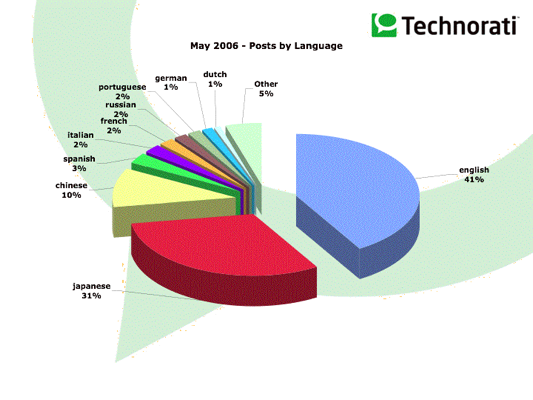
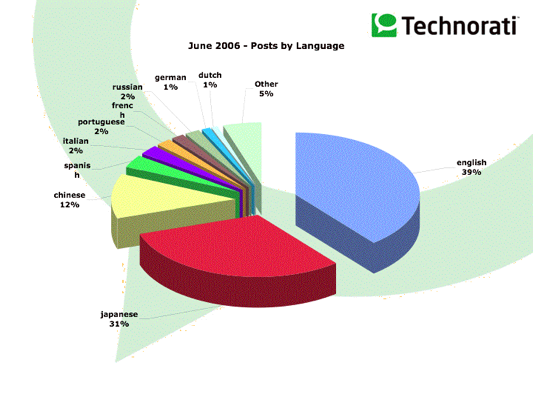
Next, let's look at the language distribution of the blogosphere. One of the most interesting statistics that has changed since the last State of the Blogosphere is that English has retaken the lead as the #1 language of the blogosphere. However, it's not by much - the Japanese blogosphere has grown substantially as well.
In April, English edged out Japanese with 34% of all postings to 33% of all postings, with Chinese taking the #3 spot with 14% of all postings.
In May, English extended its lead to 41% of all postings in the blogosphere, to 31% in Japanese and 10% in Chinese.
In June, Chinese caught up somewhat, with 39% of all postings tracked by Technorati in English, 31% in Japanese, and 12% in Chinese. It is important to note that, as in the report in April, that there are some significant underreporting issues, especially in Korean and in French, as described in that report.
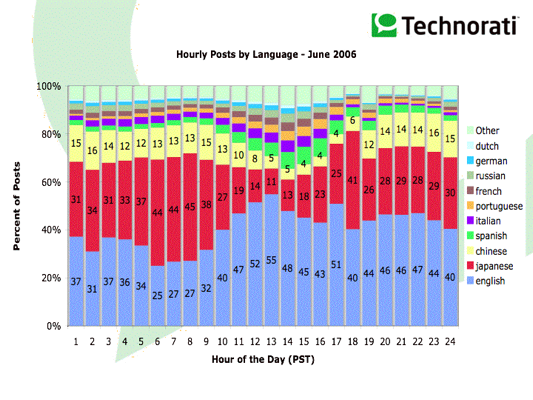
Finally, I thought it would be interesting to look at what times of day show significant posting volume by language. The chart below shows this information using Pacific time (Technorati is located in San Francisco, so we're biased towards that time zone) as our base:
It is interesting to note that the most prevalent times for English-language posting is between the hours of 10AM and 2PM Pacific time, with an additional spike at around 5PM Pacific time. Japan, which is 17 hours ahead of San Francisco, shows a different pattern - more posting occurring during the evening hours into the night, as well as the early morning hours before work begins. I'm not entirely sure what to make of these numbers, but it would appear that English-speaking people are more likely to blog during work hours and early evening in the USA, while they are more reluctant to blog during work time in Japan. More research is definitely needed to understand when and where people are blogging. Perhaps a more experienced cultural anthropologist or sociology researcher can provide better insight here, if you're interested, drop me a line at dsifry AT technorati DOT com.
In summary:
- Technorati is now tracking over 50 Million Blogs.
- The Blogosphere is over 100 times bigger than it was just 3 years ago.
- Today, the blogosphere is doubling in size every 200 days, or about once every 6 and a half months.
- From January 2004 until July 2006, the number of blogs that Technorati tracks has continued to double every 5-7 months.
- About 175,000 new weblogs were created each day, which means that on average, there are more than 2 blogs created each second of each day.
- About 8% of new blogs get past Technorati's filters, even if it is only for a few hours or days.
- About 70% of the pings Technorati receives are from known spam sources, but we drop them before we have to send out a spider to go and index the splog.
- Total posting volume of the blogosphere continues to rise, showing about 1.6 Million postings per day, or about 18.6 posts per second.
- This is about double the volume of about a year ago.
- The most prevalent times for English-language posting is between the hours of 10AM and 2PM Pacific time, with an additional spike at around 5PM Pacific time
As always, I'm very interested in your comments and feedback.
Technorati Tags: blogging, blogosphere, blogs, blogsearch, charts, language, msm, postingvolume, posts, postvolume, scaling, search, search engine, sotb, sotb2006, spam, spamblog, sping, splog, statistics, stats, technorati, update, weblog, weblogs, wow
